Key Insights: GEP Global Volatility Index January 2024
The monthly survey is a guide for procurement, purchasing and supply chain professionals around the world about the ongoing conditions, shortages, transportation costs, inventories and backlogs based on a monthly survey of 27,000 businesses. The latest data considered in the January 2024 report indicates an increase in transportation costs, an increase in safety stockpiling, and the initial signs of global manufacturing recovery.
“The world’s supply chains got busier in January, and activity at our global manufacturing clients is ticking up,” explained Daryl Watkins, Senior Director, Consulting at GEP.
“With input demand trending higher, led by Asia, signalling a return to positive growth in the coming months, it is imperative business keeps tamping down suppliers’ price increases so inflation continues to trend down,” said Watkins.
Three key insights from GEP Global Supply Chain Volatility Index
- Excess global supply chain capacity shrinks to its lowest level in nine months, showing the first signs of recovery in global manufacturing
- Demand for raw materials, commodities and components, while subdued, also trends higher in January
- Asian supply chains at their busiest in nearly a year as factory purchasing rebounds in region’s key markets
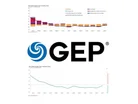
The index rose to -0.12 in January, from -0.44 in December, its highest level since last April, indicating that spare capacity across global supply chains has shrunk. Although this is the ninth successive month of excess capacity at global suppliers, the downturn eased to its weakest level since last April. The index suggests that underlying trading conditions may be starting to improve as recession and inflation fears fade and businesses prepare for a stronger 2024.
A notable change is the increase in costs of transportation linked to the conflict situation unfolding in the Red Sea. Transport costs rose to a 15-month high in January, as commercial ships took the lengthier route around the Cape of Good Hope. There was also a slight pick-up in safety stockpiling, with reports from businesses of inventory building due to supply or price fears at the highest since last June. However those numbers are well below the levels seen in 2021-2022 during the post-pandemic supply crunch.
Key Findings GEP Global Supply Chain Volatility Index
- DEMAND: Purchases of raw materials, commodities and components remained subdued, although the decline eased to its weakest since last April, hinting at improving demand.
- INVENTORIES: Reports of safety stockpiling due to supply or price concerns ticked up to a seven-month high in January as disruption through the Suez Canal led some companies to build up inventory buffers.
- MATERIAL SHORTAGES: Global supply conditions remain healthy — reports of item shortages remain among the lowest seen in four years.
- LABOUR SHORTAGES: Labour availability remains unproblematic for global suppliers, with reports of backlogs rising due to a lack of staff holding close to historically typical levels.
- TRANSPORTATION: Global transportation costs rose to a 15-month high in January, signalling some contagion from the disruption to shipping through the Suez Canal.
How does the GEP Global Supply Chain Volatility Index work?
The GEP Global Supply Chain Volatility Index is produced by S&P Global and GEP. It is derived from S&P Global’s PMI surveys and sent to 27,000 global companies. The headline figure is a weighted sum of six sub-indices derived from PMI data, PMI Comments Trackers and PMI Commodity Price & Supply Indicators compiled by S&P Global.
What do the values in the GEP Global Supply Chain Volatility Index mean?
A value above 0 indicates that supply chain capacity is being stretched and supply chain volatility is increasing. The further above 0, the greater the extent to which capacity is being stretched.
A value below 0 indicates that supply chain capacity is being underutilised, reducing supply chain volatility. The further below 0, the greater the extent to which capacity is being underutilised.
The index is published once a month and you can review the December survey here.
Make sure you check out the latest edition of Procurement Magazine and also sign up to our global conference series - Procurement & Supply Chain LIVE 2024
**************
Procurement Magazine is a BizClik brand