Four Key Insights: GEP Global Volatility Index December 23

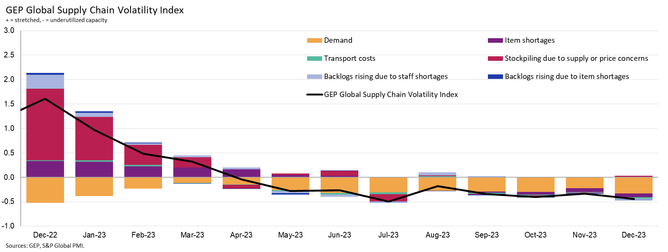
The survey is an indicator for global procurement, purchasing and supply chain professionals and leaders about the ongoing conditions, shortages, transportation costs, inventories and backlogs based on a monthly survey of 27,000 businesses. The latest December data indicates global supply chain capacity is going underutilised to the greatest extent since July at the end of 2023, with the index falling to -0.44 in December, from -0.34 in November. This marks what is now the ninth successive month of spare capacity across global supply chains, with slack at producers at one of the highest levels since COVID-19 shutdowns that occurred in early 2020.
“Rising spare capacity at suppliers worldwide means that the end to the global manufacturing recession is still some way off,” explained David Doran, vice president, consulting, GEP. “Moreover, orders at intermediate and capital goods manufacturers are still slowing, which indicates stronger headwinds ahead, providing companies with greater leverage to drive down prices in 2024.”

Four key insights from GEP Global Supply Chain Volatility Index
- Supply chain spare capacity rose in Europe, Asia and North America in December as slack reached its greatest level since July 2023.
- Excess capacity at Asia’s suppliers rises to a level not seen since June 2020, suggesting a manufacturing recovery is still some way off
- Input demand dropped more sharply in North America, which had been relatively resilient, driven by producers of intermediate and capital goods
- Recessionary conditions continue in Europe, with purchasers at the region’s manufacturers cutting back at a pace rarely surpassed in two decades of data
Order books for suppliers in North America and Asia faced a downturn in December. While these two global regions showed robust performance compared to others last year, they faced a drop, revealing signs of weakness in major economies. Asian supply chains were at their least active in three and a half years, with manufacturing industries in key economies like Japan, South Korea, and Malaysia seeing a decline. The slack in North America's supply chains was not as extensive as it was during the peak in mid-2023.
As well as this, the subdued current state of the global manufacturing industry was also highlighted by historically low reports of item shortages and backlogs, suggesting excess global supply levels, which will put further downward pressure on the prices of goods.

Key December Findings GEP Global Supply Chain Volatility Index
- INVENTORIES: Global businesses continue to demonstrate little appetite for building up their stocks, with inventory managers unwilling to hold surplus stock in warehouses.
- MATERIAL SHORTAGES: Reports of item shortages fell again in November and remained at their lowest since January 2020.
- LABOUR SHORTAGES: Reports of backlogs accumulated because of labour unavailability remain historically subdued, showing that production capacities are not constrained by staff supply.
- TRANSPORTATION: Global transportation costs have stabilised and held close to the long-term average in November.
How does the GEP Global Supply Chain Volatility Index work?
The GEP Global Supply Chain Volatility Index is produced by S&P Global and GEP. It is derived from S&P Global’s PMI surveys and sent to 27,000 global companies. The headline figure is a weighted sum of six sub-indices derived from PMI data, PMI Comments Trackers and PMI Commodity Price & Supply Indicators compiled by S&P Global.
What do the values in the GEP Global Supply Chain Volatility Index mean?
A value above 0 indicates that supply chain capacity is being stretched and supply chain volatility is increasing. The further above 0, the greater the extent to which capacity is being stretched.
A value below 0 indicates that supply chain capacity is being underutilised, reducing supply chain volatility. The further below 0, the greater the extent to which capacity is being underutilised.
The index is published once a month and you can review the November and October surveys here.
Make sure you check out the latest edition of Procurement Magazine and also sign up to our global conference series - Procurement & Supply Chain LIVE 2024
**************
Procurement Magazine is a BizClik brand


